Can College and University Endowments Do More?
Recent policy proposals assume endowments can do more to reduce the reliance on student revenue, and thus the cost of a college education. These proposals aim to shift more endowment wealth to current student beneficiaries. Our analysis shows that while well intentioned, these proposals will affect endowment and organizational stability and intergenerational equity. While endowments may be able to do more to support the enterprise and thus lower the cost of attendance, considering the implications of current policy proposals is critical, as is examining other strategies that could address current pricing concerns.
Over the past 20 years, college and university endowments have nearly doubled their wealth, yet published tuition and fee prices have followed a similar upward trajectory and many students struggle to pay the cost of attendance. It is logical and responsible for people who understand the value of higher education and the importance of accessible pricing to ask: Can universities do more with their endowment wealth to make the price of attendance more affordable?
This research note considers some of the potential technical restrictions that endowment stewards may face as they look to increase endowment distributions. We move beyond these potential obstacles to consider three proposed policies that are intended to shift endowment wealth to current beneficiaries. We will show that these well-intended policy shifts may, in fact, have results that run counter to their own objectives. Although each initially succeeds in greater wealth distribution, that munificence comes at the cost of stability and intergenerational equity. We conclude with suggestions about additional ways institutions can accomplish the goal of lowering the costs passed along to students.
Can Endowments Do More? Maybe
The complete answer to this question is nuanced. First, some endowments already contribute to varying degrees to offset the cost of attendance. This support can take the form of financial aid to reduce what a student actually pays relative to the published tuition and fees, or operating support that can limit the institution’s reliance on revenues from tuition. While steady growth in published tuition and fee rates garner the most attention, Figure 1 shows that net tuition and fee revenues (after deducting financial aid, including scholarships and grants) are lower now than they were in 2007. Some universities use endowment distributions to subsidize the tuition discount, while many others offer discounts without corresponding endowment support.
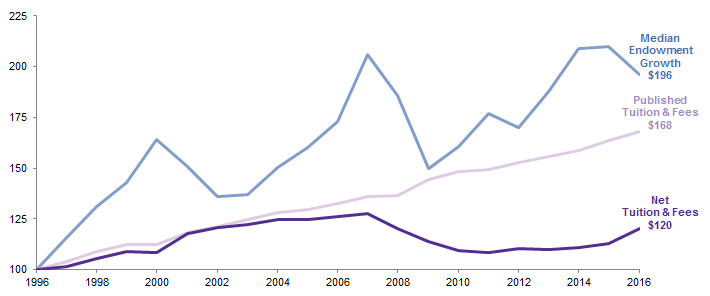
Figure 1. Cumulative Growth in Endowment Value versus Tuition & Fees for Private Colleges and Universities
Periods Ended June 30 • US Dollar • Rebased to $100 in 1996
Sources: Cambridge Associates LLC, Annual Pool Returns Survey for Colleges and Universities and The College Board, Annual Survey of Colleges.
Notes: Median endowment growth reflects data for 73 private colleges and universities that reported 20 years of endowment market values to Cambridge Associates’ Pool Returns database. The number of institutions that reported tuition and fees data to The College Board was not provided.
Second, whether more endowment support can be steered toward lowering the cost of attendance depends on the purpose of endowment funds. Endowments are contracts that typically come with restrictions on how they can be spent. While for convenience the singular “endowment” is often used, an institution’s endowment is really a composite of individual funds that have been restricted by donors as permanent capital for a specific purpose. Endowment gifts support diverse activities within a comprehensive institution, including undergraduate financial aid, faculty positions, academic and extracurricular programs, research, facilities, and graduate programs. The amount of endowment that has been donated for financial aid and scholarships can vary significantly depending on institutional priorities and donor affinities.
Lastly, endowments are permanent capital, meant to last in perpetuity, and to benefit generations of students, families, faculty, and other stakeholders. Annual endowment spending may depend on donor agreements, university policies, and the Uniform Prudent Management of Institutional Funds Act (UPMIFA 1 ), which in some states may limit the annual spending from a donor-restricted endowment.
Modeling the Proposals—Putting Endowments to Work
Institutional leaders and legislators are developing proposals that mandate growth and spending levels to increase endowment support, often with the aim of making higher education more affordable. These proposals include capping endowment growth, tying endowment investment earnings to financial aid awards, and increasing the annual endowment spending rate. We model the impact of each of these proposals on the spending and market value of a hypothetical $100 million endowment over the past 30 years. 2 We then compare the impact of these proposals to the spending and market values that would have resulted from a more typical endowment spending policy. 3 The past 30 years includes both high and low return environments for equities and bonds (Figure 2), and we also show the impact of the proposed policies versus the “typical policy” in both of these sub-periods.

Figure 2. Average Annual Compound Returns: 70/30 Portfolio
Source: Cambridge Associates LLC.
Proposal 1: Cap the Growth of the Endowment
The quest to ensure that endowments are sufficiently supporting students often leads to the question: How big an endowment is enough? Some proposals seeking to limit endowment growth place a cap on the amount the portfolio can grow, requiring greater disbursements when investment returns soar to keep growth in check. Our analysis compares the annual endowment distribution and market value results of the Typical Policy of spending 5% of a trailing moving average market value to a Cap Policy. The Cap Policy starts with the Typical Policy, but adds a requirement that caps endowment growth at 125% of the original endowment value, adjusted for inflation.
The Cap Policy achieves the goal of distributing more wealth and preserving purchasing power in the high return environment, but over the full 30-year period we analyze, the spending stream of the Cap Policy erodes the purchasing power of the endowment and ultimately leads to less support than the Typical Policy (Figure 3). During the low return environment, the capped endowment generates less support for the university. Because assets in excess of 125% of the original endowment value were spent during the flush years from 1986 to 2000, less was available for spending in the lean years that followed. Indeed, the cap spending mechanism is not triggered during the low return environment because the endowment does not bump up against the cap value at any point from 2001 to 2016.
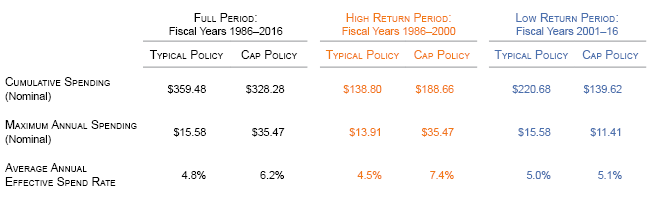
Figure 3. Proposal 1: Cap the Growth of the Endowment
Source: Cambridge Associates Endowment Spending Model.
Notes: All scenarios assume a starting endowment value of $100 million on June 30, 1985. A spending rate of 5% applied to the trailing 12-quarter average market value is used for both the Typical Policy and Cap Policy. The Cap Policy adds a cap on endowment growth at 125% of the original endowment value, adjusted for annual spending and inflation.
Annual Spending. Unlike the Typical Policy, which smooths spending by tying it to an average of endowment market values over 12 quarters, the institution with a Cap Policy faces more unpredictable spending, as it only benefits from smoothed spending when endowment values remain below the 125% growth maximum. When strong investment performance results in a larger endowment, spending distributions surge (Figure 4). Looking back over the past 30 years, the Cap Policy curbs endowment growth and generates spending spikes during 1987–88 and 1998–2000. After the spikes in spending, the Cap Policy generates lower annual distributions than the Typical Policy because spending is calculated as a percentage of a reduced endowment market value. In each year from fiscal year 2001 to the present, the annual distributions from the Typical Policy exceed those from the proposed Cap Policy. In all but one of these years, the annual distributions from the Typical Policy are more than 50% greater than the annual distributions from the Cap Policy.
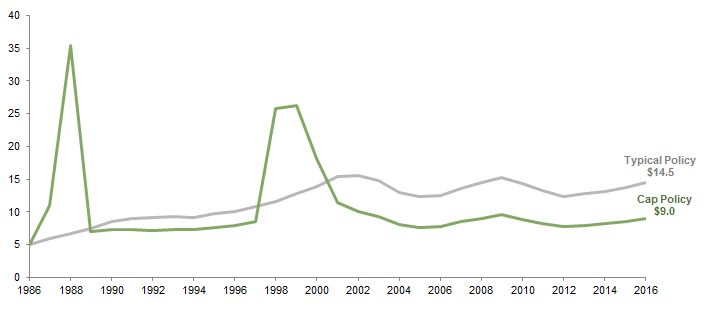
Figure 4. Nominal Annual Spending for Typical Policy versus Cap Policy
Fiscal Years 1986–2016 • US Dollar (millions)
Source: Cambridge Associates Endowment Spending Model.
Notes: All scenarios assume a starting endowment value of $100 million on June 30, 1985. A spending rate of 5% applied to the trailing 12-quarter average market value is used for both the Typical Policy and Cap Policy. The Cap Policy adds a cap on endowment growth at 125% of the original endowment value, adjusted for annual spending and inflation.
The unpredictable distributions resulting from the Cap Policy can complicate the annual budget process as the infusions of revenue make it difficult to spend consistently on programs and financial aid. To remedy this volatile spending stream, the university would need to establish one-time grants or create reserve funds outside of the endowment to smooth the flow of distributed dollars to the budget. One-time financial aid grants would create greater intergenerational inequities, as fewer students would benefit from market spikes today than would benefit from more financial aid grants smoothed over time. The university would face challenges of distributing financial aid evenly over a student’s career to avoid “bait and switch” funding. 4 If reserve funds are established to smooth the flow of endowment dollars to the budget, the university would need to employ additional spending policies and accounting practices to ensure reserves are spent on their designated purposes. These responses offer solutions, but also inefficiencies that hinder long-term planning and successful investment management practices.
Intergenerational Purchasing Power. The Cap Policy goal of putting the endowment to work fairly can be thwarted by inconsistent investment performance. Under the Typical Policy, “excess earnings” from the high return environment are reinvested instead of spent immediately. This results in a larger portfolio value going into the low return environment and higher annual endowment support throughout that period.
If we concluded our analysis in 2000 to isolate the high return environment that took place from 1985 to 2000, and look at results in real terms, the Cap Policy does its job beautifully—distributions are greater than the Typical Policy, while the real purchasing power of the endowment value is preserved. But when time rolls on beyond high returns into the inevitable market correction, the flaw of the Cap Policy becomes apparent (Figure 5).
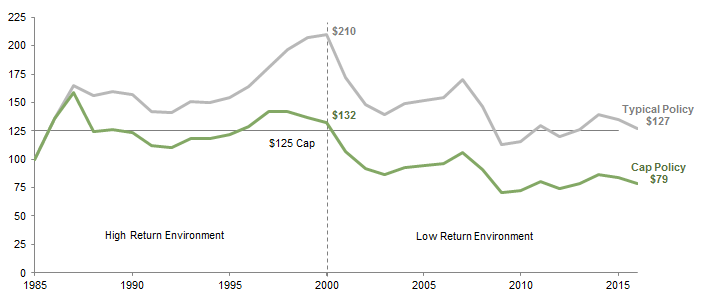
Figure 5. Real Endowment Market Value for Typical Policy versus Cap Policy
Periods Ended June 30 • US Dollar (millions)
Source: Cambridge Associates Endowment Spending Model.
Notes: All scenarios assume a starting endowment value of $100 million on June 30, 1985. Market values are adjusted for inflation using the Consumer Price Index. A spending rate of 5% applied to the trailing 12-quarter average market value is used for both the Typical Policy and Cap Policy. The Cap Policy adds a cap on endowment growth at 125% of the original endowment value, adjusted for annual spending and inflation.
While the inflation-adjusted value of the endowment exceeds its initial value in 2001, the portfolio is not sufficient to maintain its value throughout the low return environment. Under the Cap Policy, the real market value drops below the initial gift value ($100) in fiscal year 2002 and falls to $70 in fiscal year 2009. By fiscal year 2016, the real market value is still just $79 and well below the Typical Policy ending real market value ($127). The depleted market value prevents the endowment from maintaining spending at a consistent level for the generation of beneficiaries that are counting on the endowment support during the low return environment. So while the policy is effective for a short period of time, it is not effective over the long term. It favors the beneficiaries during the higher return environment at the cost of future beneficiaries.
Proposal 2: Link a Portion of Earnings to Annual Spending
Some proposals seek to establish a more direct link between annual endowment earnings (i.e., total annual investment return) and annual endowment spending. Certain proposals link a portion of annual earnings to funding for financial aid; if performance exceeds a specified hurdle, the earnings on that excess are directed to financial aid. Those proposals may run into technical realities of donor restrictions that limit the amount of endowment earnings that can be directed to financial aid. Our analysis sets aside the specificity of how the excess earnings may be spent to consider the impact of an earnings-linked type of endowment spending policy.
The proposed policy in this scenario starts with a typical 5% of moving average market value spending rule, and then for a portion of the portfolio adds to the calculated spending distribution during periods of high returns. The Earnings-Linked Policy focuses on 25% of the portfolio that is designated for a priority purpose, such as financial aid. Specifically, if the distribution for that priority purpose is less than 25% of earnings then additional distributions are made, so that total spending for that priority purpose equals a minimum of 25% of earnings.
The Typical Policy and the proposed Earnings-Linked Policy end the 30-year period with similar cumulative spending, but the Earnings-Linked Policy has a significantly lower market value (Figure 6). Similar to the Cap Policy, spending that is more closely linked to market conditions is more volatile and reduces the endowment’s ability to weather the low return environment. Unlike the Cap Policy that did not kick in during the low return environment, the Earnings-Linked Policy responds to each market upturn with greater spending, even during the low return environment. This leads to higher spending even when the portfolio has lost value, greater erosion of endowment market value, and ultimately lower spending because the endowment becomes depleted.
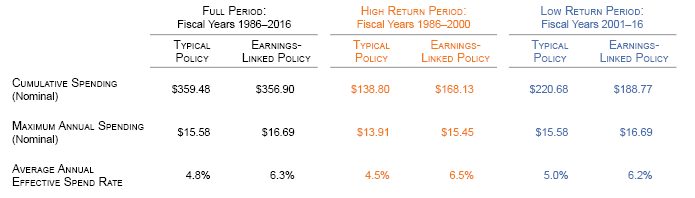
Figure 6. Proposal 2: Link a Portion of Earnings to Annual Spending
Source: Cambridge Associates Endowment Spending Model.
Notes: All scenarios assume a starting endowment value of $100 million on June 30, 1985. A spending rate of 5% applied to the trailing 12-quarter average market value is used for both the Typical Policy and Earnings-Linked Policy. For the Earnings-Linked Policy, 25% of the distribution is tied to earnings.
Annual Spending. While the Typical Policy smooths market values over multiple years, the Earnings-Linked Policy generates a more volatile spending stream (Figure 7). We see the danger of an earnings-linked policy during and immediately following the periods of substantial market value declines: 2002–04 and 2009–11. Annual spending during these periods is more than 35% lower than the Typical Policy. Although the Earnings-Linked Policy was implemented to guard against hoarding and get the endowment to work, the policy reduces the endowment distribution during recessionary periods when the support, particularly for financial aid, is likely to be needed the most. Similar to our assessment of Proposal 1, higher spending during high returning market cycles leaves a depleted endowment to weather a market downturn. The Typical Policy, which spends 5% of a smoothed market value over a 12-quarter trailing period, does a better job of providing dependable spending to current and future beneficiaries and preserving the permanent capital, so the endowment is better positioned to fulfill its financial objectives in perpetuity.
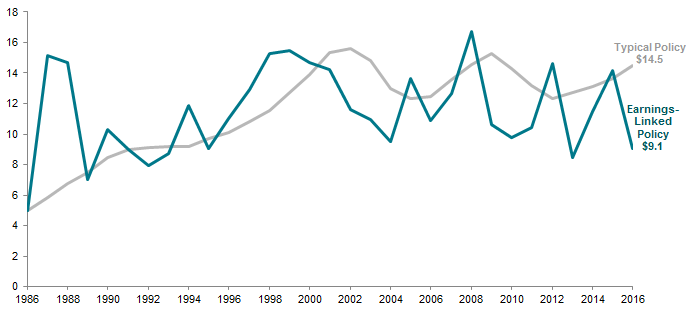
Figure 7. Nominal Annual Spending for Typical Policy versus Earnings-Linked Policy
Fiscal Years 1986–2016 • US Dollar (millions)
Source: Cambridge Associates Endowment Spending Model.
Notes: All scenarios assume a starting endowment value of $100 million on June 30, 1985. A spending rate of 5% applied to the trailing 12-quarter average market value is used for both the Typical Policy and Earnings-Linked Policy. For the Earnings-Linked Policy, 25% of the distribution is tied to earnings.
Intergenerational Purchasing Power. During the high return period, the endowment could withstand the additional spending required by the Earnings-Linked Policy and still increase its real purchasing power, but similar to the Cap Policy, over the longer time horizon of the 30-year period the endowment could not sustain its original value under the Earnings-Linked Policy (Figure 8). This policy exacerbates endowment declines by spending more in the low return environment and results in greater inequities between current and future beneficiaries relative to the Typical Policy.
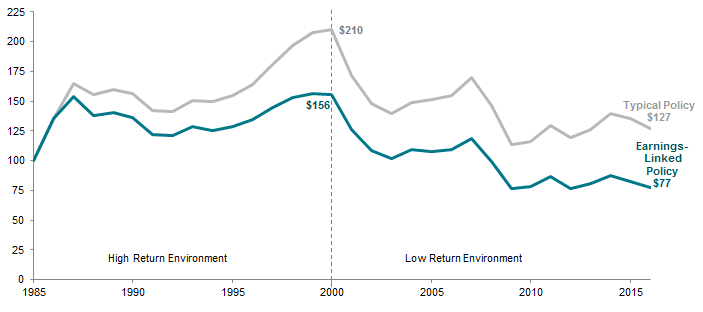
Figure 8. Real Endowment Market Value for Typical Policy versus Earnings-Linked Policy
Periods Ended June 30 • US Dollar (millions)
Source: Cambridge Associates Endowment Spending Model.
Notes: All scenarios assume a starting endowment value of $100 million on June 30, 1985. Market values are adjusted for inflation using the Consumer Price Index. A spending rate of 5% applied to the trailing 12-quarter average market value is used for both the Typical Policy and Earnings-Linked Policy. For the Earnings-Linked Policy, 25% of the distribution is tied to earnings.
Proposal 3: Spend More Annually by Increasing the Spending Policy Rate
The final proposal we consider simply examines the implications of spending at a higher rate. In this scenario, we compare the Typical Policy, a 5% market value policy, to a 6% market value policy (Higher Rate Policy). Both calculate spending by applying the policy rate to the average of the trailing 12-quarter market values. Similar to the Cap Policy and the Earnings-Linked Policy, the Higher Rate Policy biases endowment spending to present generations. Also similar to the other two policies, this approach works well in the high return environment, but is not successful in the low return environment or over the long-term period we evaluated (Figure 9).
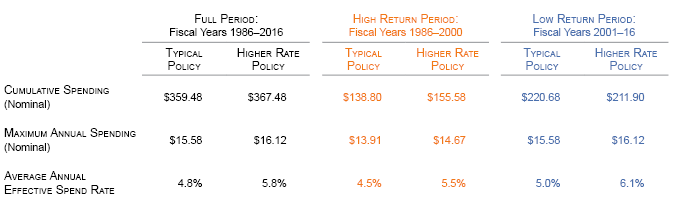
Figure 9. Proposal 3: Spend More Annually by Increasing Policy Rate
Source: Cambridge Associates Endowment Spending Model.
Notes: All scenarios assume a starting endowment value of $100 million on June 30, 1985. A spending rate of 5% applied to the trailing 12-quarter average market value is used for the Typical Policy. The Higher Rate Policy uses a 6% spending rate applied to the 12-quarter average market value.
Annual Spending. Under the Higher Rate Policy, annual spending is higher than the Typical Policy during the higher-returning first 15 years of the 30-year cycle, but this shifts in 2005 (Figure 10). Similar to the first two proposals, higher spending in the first part of the 30-year cycle depletes the market value of the Higher Rate Policy endowment, which eventually distributes less annual support than the Typical Policy, despite the higher rate of spending. The Higher Rate Policy spends more cumulatively in each of the three timeframes we study, but the distribution favors the beneficiaries early in the cycle, to the detriment of the beneficiaries who come later.
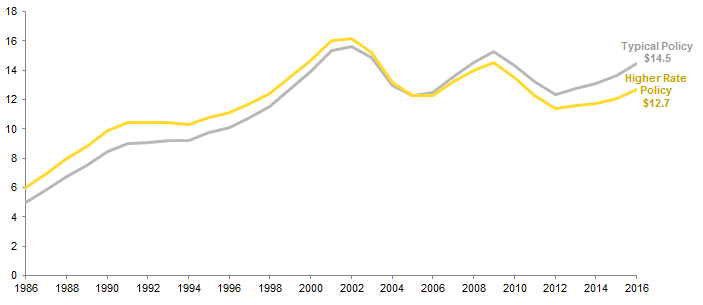
Figure 10. Nominal Annual Spending for Typical Policy versus Higher Rate Policy
Fiscal Years 1986–2016 • US Dollar (millions)
Source: Cambridge Associates Endowment Spending Model.
Notes: All scenarios assume a starting endowment value of $100 million on June 30, 1985. A spending rate of 5% applied to the trailing 12-quarter average market value is used for the Typical Policy. The Higher Rate Policy uses a 6% spending rate applied to the 12-quarter average market value.
Intergenerational Purchasing Power. The Higher Rate Policy reduces the real purchasing power of the endowment because over the 30-year period the endowment outspends its 5.8% real investment return. If we stop our analysis at the end of the high-performing market environment, the endowment has preserved its real purchasing power, but similar to the Cap Policy and the Earnings-Linked Policy, the Higher Rate Policy does not achieve a goal of intergenerational equity (Figure 11). The depleted endowment provides less support for financial aid and other programs in the low return environment, just when it may be needed the most.
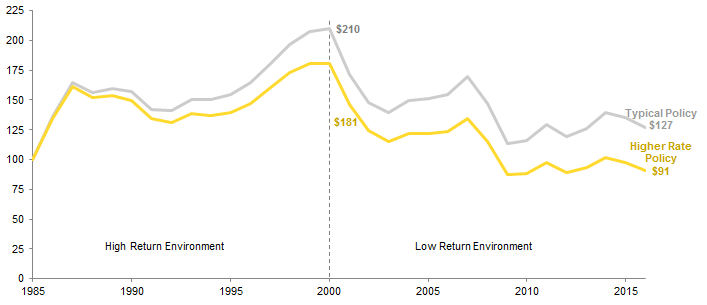
Figure 11. Real Endowment Market Value for Typical Policy versus Higher Rate Policy
Periods Ended June 30 • US Dollar (millions)
Source: Cambridge Associates Endowment Spending Model.
Notes: All scenarios assume a starting endowment value of $100 million on June 30, 1985. Market values are adjusted for inflation using the Consumer Price Index. A spending rate of 5% applied to the trailing 12-quarter average market value is used for the Typical Policy. The Higher Rate Policy uses a 6% spending rate applied to the 12-quarter average market value.
What Are the Chances?
Since “history doesn’t repeat itself, but it does rhyme,” we also include Monte Carlo analysis to assess the impact of spending policy decisions based on simulations of thousands of different investment scenarios over a 30-year time horizon (Figure 12). Monte Carlo simulations incorporate consistent long-range return expectations and do not incorporate the market swings of the historical scenarios in our spending model, but we do see similar themes in the results. The Typical Policy is the only policy that has more than a 50% probability of preserving the real purchasing power of the endowment. The Earnings-Linked Policy—the most closely tied policy to annual investment results—has the lowest probability of maintaining purchasing power; even the high end of its expected range falls short of the real value of the initial endowment. The Higher Rate Policy provides the greatest amount of cumulative spending over a 30-year time horizon, but does so at the cost of preserving purchasing power.
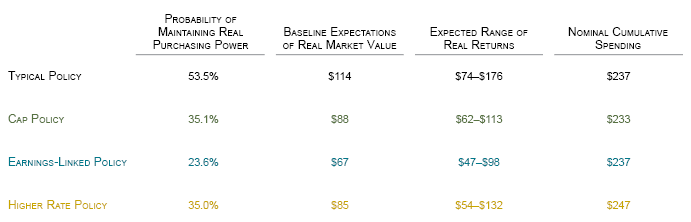
Figure 12. Impact of Spending Policy Decisions: 30-Year Monte Carlo Simulation
Source: Cambridge Associates Endowment Spending Model.
Notes: All scenarios assume a starting endowment value of $100 million. A spending rate of 5% applied to the trailing 12-quarter average market value is used for the Typical Policy, Cap Policy, and Earnings-Linked Policy. The Cap Policy adds a cap on endowment growth at 125% of the original endowment value, adjusted for annual spending and inflation. For the Earnings-Linked Policy, 25% of the distribution is tied to earnings. A spending rate of 6% applied to the trailing 12-quarter average market value is used for the Higher Rate Policy.
* Range represents the middle 50% of the distribution (25th to 75th percentile).
Other Remedies that May Address Affordability, Without Sacrificing Endowment
All of this is not to say that schools must be “prisoners” of their endowments. If affordable access is a priority, universities have other avenues to explore that might bolster efforts to make tuition more affordable for their students without sacrificing the endowment support available to students in the future.
First, although many existing endowment funds may be earmarked for specific purposes such as faculty positions, academic programs, and athletics, some funds may not be. Universities can look for unrestricted capital in their existing endowment funds that they can put to use supporting students and families who need the help.
Second, schools can make a concerted effort to secure greater funding for financial aid. This may be a combination of fundraising for current gifts that can be immediately put to use to support students and for new endowments funds geared toward tuition assistance that will bolster long-term capacity to provide more support and to extend opportunities to a greater number of students.
Revenue is only one side of the financial equation. Colleges and universities can also continue to manage some of the costs that drive up tuition and ask themselves whether anything can be done to make their cost structures more efficient and affordable. Higher education is an industry that is driven by personnel, but escalating costs may also be the result of ambitious campus plans that include renovated and new facilities, and the debt and ongoing maintenance costs that often accompany them.
Conclusion
Colleges and universities are already working to keep the net price of attendance under control, and endowments support these efforts. Endowments can do more to support current students, but this largesse comes at a cost. As our analysis has shown, the policies proposed to distribute more endowment wealth deplete endowments to a degree that they provide less support to future generations of students. Endowments are permanent capital, and are therefore prudently governed by long-term investment and spending policies that have been designed to balance the goal of endowment growth that keeps pace with inflation and spending that supports generations of stakeholders fairly and in perpetuity.
Although higher endowment spending can address some of the immediate pricing concerns that activists are calling for, the solution is not sustainable. To address price relief in a more sustainable way, colleges and universities can look to raise more endowment for financial aid, fundraise for current use dollars that are not restricted as permanent resources, shift unrestricted resources to fund financial aid, and limit expense growth (lowering the need for raising tuition and thus increased financial aid). College and university fiduciaries balance the needs of today and tomorrow; this includes the stewardship and use of the endowment.
Tracy Filosa, Managing Director
William Prout, Investment Director
Geoffrey Bollier, Associate Investment Director
Meredith Wyse, Senior Investment Associate
Footnotes
- UPMIFA is adopted at the state level (only Pennsylvania and Puerto Rico have yet to adopt), therefore specific state statutes can differ. Institutions should determine their interpretation and approach to endowment management in light of their state’s legislation and after conferring with legal counsel.
- Returns are based on a portfolio composed of 70% MSCI World Index and 30% Bloomberg Barclays Government/Credit Index, and the fund is rebalanced annually. Inflation is applied using the Consumer Price Index. As an exercise in considering the impact of the various spending policies, this simple portfolio is used as a proxy for an endowment allocation over the full period. Although endowment portfolio allocations have become significantly more diversified over the past 30 years, the 70/30 portfolio produced returns comparable to that of institutions that report to the Cambridge Associates Pool Returns database. The median nominal AACR among reporting institutions was 9.4% for the full period and there was similarly a wide gap between the median return of the high return environment (13.8%) and the low return environment (5.3%).
- The most frequently used endowment spending policy is a market value–based rule that dictates spending 5% of a moving 12-quarter average of endowment market values. This rule has been devised to set spending at a rate that links spending to investment performance, but has a long time horizon so shifts in spending do not destabilize the operating budget. Long-term investment return expectations for a diversified portfolio should enable an endowment to meet 5% spending and keep pace with inflation, so the endowment continues its level of support in real terms. All spending scenarios studied in this report treat the endowment as a single fund with no future inflows. Spending is calculated at the beginning of each fiscal year (July 1) and taken out of the endowment once a year (on October 1).
- “Bait and switch” funding occurs when financial aid is available for initial year or years of study, but not all four years of undergraduate study.